Popular Questions for Management Assignment Questions
To help, students understand the wide variety of assistance with law assignment questions we have successfully delivered in the past, we are showcasing a small sample of University Assessments related to Management Assignment Question.If you want to order a similar assignment reach out to our management subject matter experts.
Background
This case study, although simplified, has been derived from a real world industrial situation. The names of the personnel have been changed and confidential information modified or removed.
The Cranfield Agricultural Tractor Company (CAT) has been in existence for 100 years, originally producing a limited range of agricultural tractors. It now produces many products and product variants used in agriculture, building and construction, and mining. The company has ambitions to grow further, particularly through overseas expansion, but is concerned about the working capital that will be required to double the size of the company extrapolating from the current situation. As a result the CEO, Hannibal Lecter, has announced that the Cornfield Agricultural Tractor Company will adopt 6 sigma. Deployment champions have been appointed and over 30 black belts are now in position and the company is now training its own master black belts.
Although the company as a whole is rather profitable, one of the products – the small hydraulic articulated teleloader – has been a problem product since its introduction 3 years ago. There are 3 platforms (X, Y and Z) being assembled on one assembly line. The management team has struggled to make this product profitable; there is now a mandate from corporate headquarters that the product team has one financial year to turn the situation around. Failure to do so will result in withdrawal of the investment required to update the design and to keep it in the market place. Ultimately this will result in the removal of the product from the market and disbandment of the product team.
The product manager, Freddy Kruger, has sponsored a 6 sigma project to establish what the real problems are and appointed a 6 sigma blackbelt, Norman Bates, to look at the situation. Norman immediately advocated carrying out a value stream mapping exercise. Norman made requests for greenbelts from the product team and now has 2 people in training on the project.
The team have just completed their draft current state value stream map, by actually walking as much of the flow of the product as possible, counting machines and parts where appropriate, and complementing this with information from systems. They are now debating what to present back to Freddy Kruger.
They agree that the task is large and needs breaking down into manageable chunks. Their aim is to identify the chunks, prioritize them and describe what sort of tools they may try and apply for each chunk or project.
The Value Stream Map (VSM)
Although the team were only able to actually walk the part of the value stream on their site, they chose to produce a map from suppliers through to the dealers. The suppliers were grouped recognising :
• United Kingdom based suppliers (UK)
• European Suppliers (EURO)
• United States bases suppliers(US)
• Rest of World (ROW)
It has been noted that the source of supply impacts the lead time (see VSM)
The team also noted there are 170 suppliers with 18 supplying more than 20 parts, 43 with 5 to 20 parts, and 109 with less than 5 parts.
The components are received by Soylent Green Logistics with an average of 10 days inventory on hand in the receiving area. In the stores there is an average of 70 days inventory on hand. It takes from less than 1 day to 8 days to put a part away into its designated storage location.
Soylent deliver all parts to line, with the exception of hydraulic hoses which come directly from the hose plant. Some parts are sequenced to line, typically large parts like engines and wheels. They also sub assemble some parts and deliver them to line similar to any other sequenced component. Smaller parts are taken to line in bins of some sort, typically using a trailer train.
The Cranfield assembly line has several workstations, these have been simplified in the value stream map:-
• Mainline Assembly (assy)
• Test 1 & 2
• Mainline Assembly
• Rolling Road Test
• Load Test
• Audit Dress Paint
• Ready to Ship (RTS)
• 100% Audit
The team also noted that there were some other workstations set up which were not on the original plant drawings. These workstations had been set up by the manufacturing engineers because problems were being experienced on line and additional facilities were required.
There is also a shipping and reconfiguration area where some machines are stored (some of which is dealer stock) and reconfigured to customer order. This area also organizes the physical shipping of machines. Shipping paperwork is prepared for each machine. Any additional goods like work-tools (buckets etc.) and work wear are packaged and the machines are physically marshaled so that they correspond to their load configurations i.e. grouped into truckloads.
Soylent Green haulage ship all the machines out of the plant and onto the dealers, with Tractors R’ Us and Tractor World being key dealers involved in the preparation and reconfiguration area. Machines are shipped all over the world with 3 areas being recognized on the VSM:-
• Europe
• USA
• Rest of World
The value stream map also indicates some of the systems that are used to control the supply chain. There is a local ERP system which has a sequencing module to apply constraint based sequencing to the assembly line. Sequences are transmitted to suppliers via a website.
There are also corporate systems shared by all the product groups and different plants. These are for order capture and also organizing the after market (spares) part of the business. These systems also include functionality to help the dealerships run their businesses with orders, forecasting and financial projections.
The following symbols have been used on the VSM:-

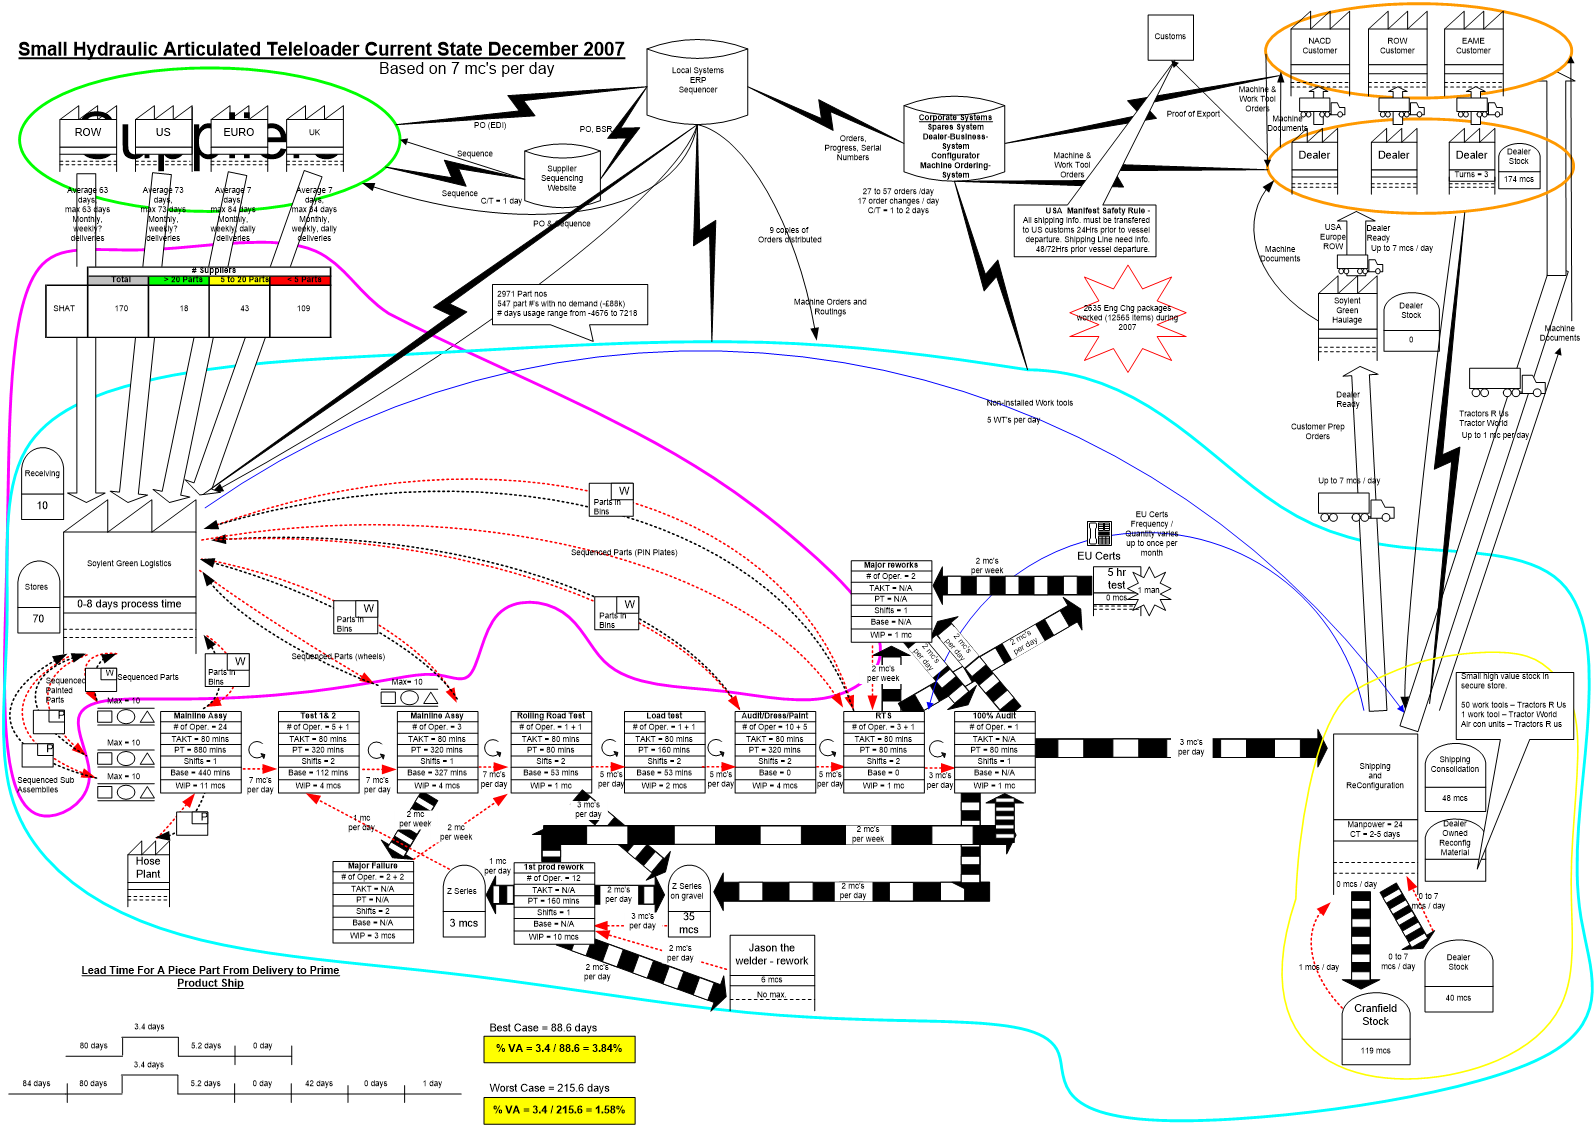
Value Stream Map Data
Basic data for each workstation has been captured including:-
• Workstation Name
• The number of operators
• The total available cycle time (TAKT Time), which relates to the rate of production
• Planned Production time in minutes (PT) – this may be divided by several operators to fit into the TAKT
• The number of shifts that the workstation operates for
• The minimum number of minutes observed for each workstation i.e. the number of minutes the operators are working at that point in the process.
Observations
Components and sub assemblies are received by the logistics partner Soylent Green Logistics who execute receiving, material storage, some sub assembly and delivery of parts to the main line assembly. The outsourced, Soylent part of the process is currently out of scope and subject to further negotiation with Soylent. (Soylent activities have been ring-fenced using a purple line).
There are several flows from Soylent to various parts of the mainline:-
Sequenced Parts
• Sequenced painted parts and sequenced sub assemblies to the start of the line (big parts here are chassis, engine and cab)
• Sequenced wheels to the middle of the lines (wheel and tyre combinations are often specific to a particular machine order perhaps with custom colour)
• Sequenced product identification number plates (PIN plates) to the shipping and documentation stage
Non Sequenced Parts
There are 4 flows of parts in bins to deliver to all workstations via trailer train:-
• Start of the line
• Middle of the line
• Audit dress stage
• Shipping and documentation stage (machine manuals stickers etc.)
Hydraulic Hoses
Hydraulic hoses are assembled and delivered on a just in time basis to all assembly lines – there are no particular issues here.
Rework
It has been observed that there is substantial rework occurring within the assembly which is not really reflected in the daily reporting.
After test 1
We see machines with serious failures which meant that they could not progress to the next assembly station on the line; this meant that the line stopped until they could be fixed. Records show that on average there are 2 failures per week after test 1.
Shipping & Documentation
We see that 2 machines per week were taking detours through the major reworks area before going on to the 100% audit area.
100% Audit
2 Machines per day are being diverted through the major reworks area. Approximately 2 machines per day are identified as having parts of the wrong engineering level i.e. an engineering change to the product has been approved since the machine was launched on line. This may be for safety reasons, cost reduction, due to shortage of a new part type, or confusion over engineering levels at any point in time. This type of rework is called a first production rework.
Approximately 2 machines per day pass from this area to an ad hoc welding area where additional brackets (e.g. for lights etc.) are welded onto the chassis by Jason the welder, who can fix about 6 machines per day if necessary. This is another form of rework and is driven by minor parts being missed off the chassis fabrication. Around this rework loop we counted 35 machines sitting on the gravel outside the main building.
Shipping and Reconfiguration
There are 24 people working in this area ensure that shipping documentation, export paperwork etc. is correct and that the machine corresponds to the customer order including any work tools (buckets, forks etc.) that may be shipped with the machine but not attached or assembled to it. After this stage the machines may be directly shipped or they may go into either Cranfield stock or dealer stock. This is dealer owned stock held next to the plant which the dealer would prefer to keep there, so that when a customer order matching the configuration is received it can be shipped directly to the customer. This is a preferred method for 2 dealers, Tractors R Us and Tractor World, which is thought to reduce total transport cost by avoiding shipping via a dealer stock yard.
Value Added Time
The shortest elapsed time from receiving the first part to shipping the elapsed product is 88 days with the total value added time (the amount of time that value added work is being carried out) being over 3 days, giving a value added ratio of 3.84%. The worst case has an elapsed time of 215 days with value added of 1.58%.
Define Phase
The first stage in the project that the team decided to address first was the Control of Engineering Change.
The big observation from the value stream map was the level of failures that were directed to the first production rework area. This area was specifically set up with engineering support to ensure that machines on line were produced to the latest engineering levels (latest drawings). Machines are being produced on line that do not correspond to the drawings that are currently issued. Engineering changes are being made all the time:
• some are safety driven, their implementation is therefore critical
• others are failures in the market
• some are requested through the dealer networks to try and improve the product.
The product design does not appear to be in control: changes are being made to the designs, suppliers are getting confused and using the wrong drawings to produce components.
Investigation with engineering showed that 2635 engineering change packages (groups of drawings) had been worked during 2007.
Measure Phase
Manpower – definition of people usage in the production system:

It was identified that there is an opportunity to remove up to 13 people (including Jason the welder) associated with the 1st production reworks, which would reflect better control of the engineering change process.
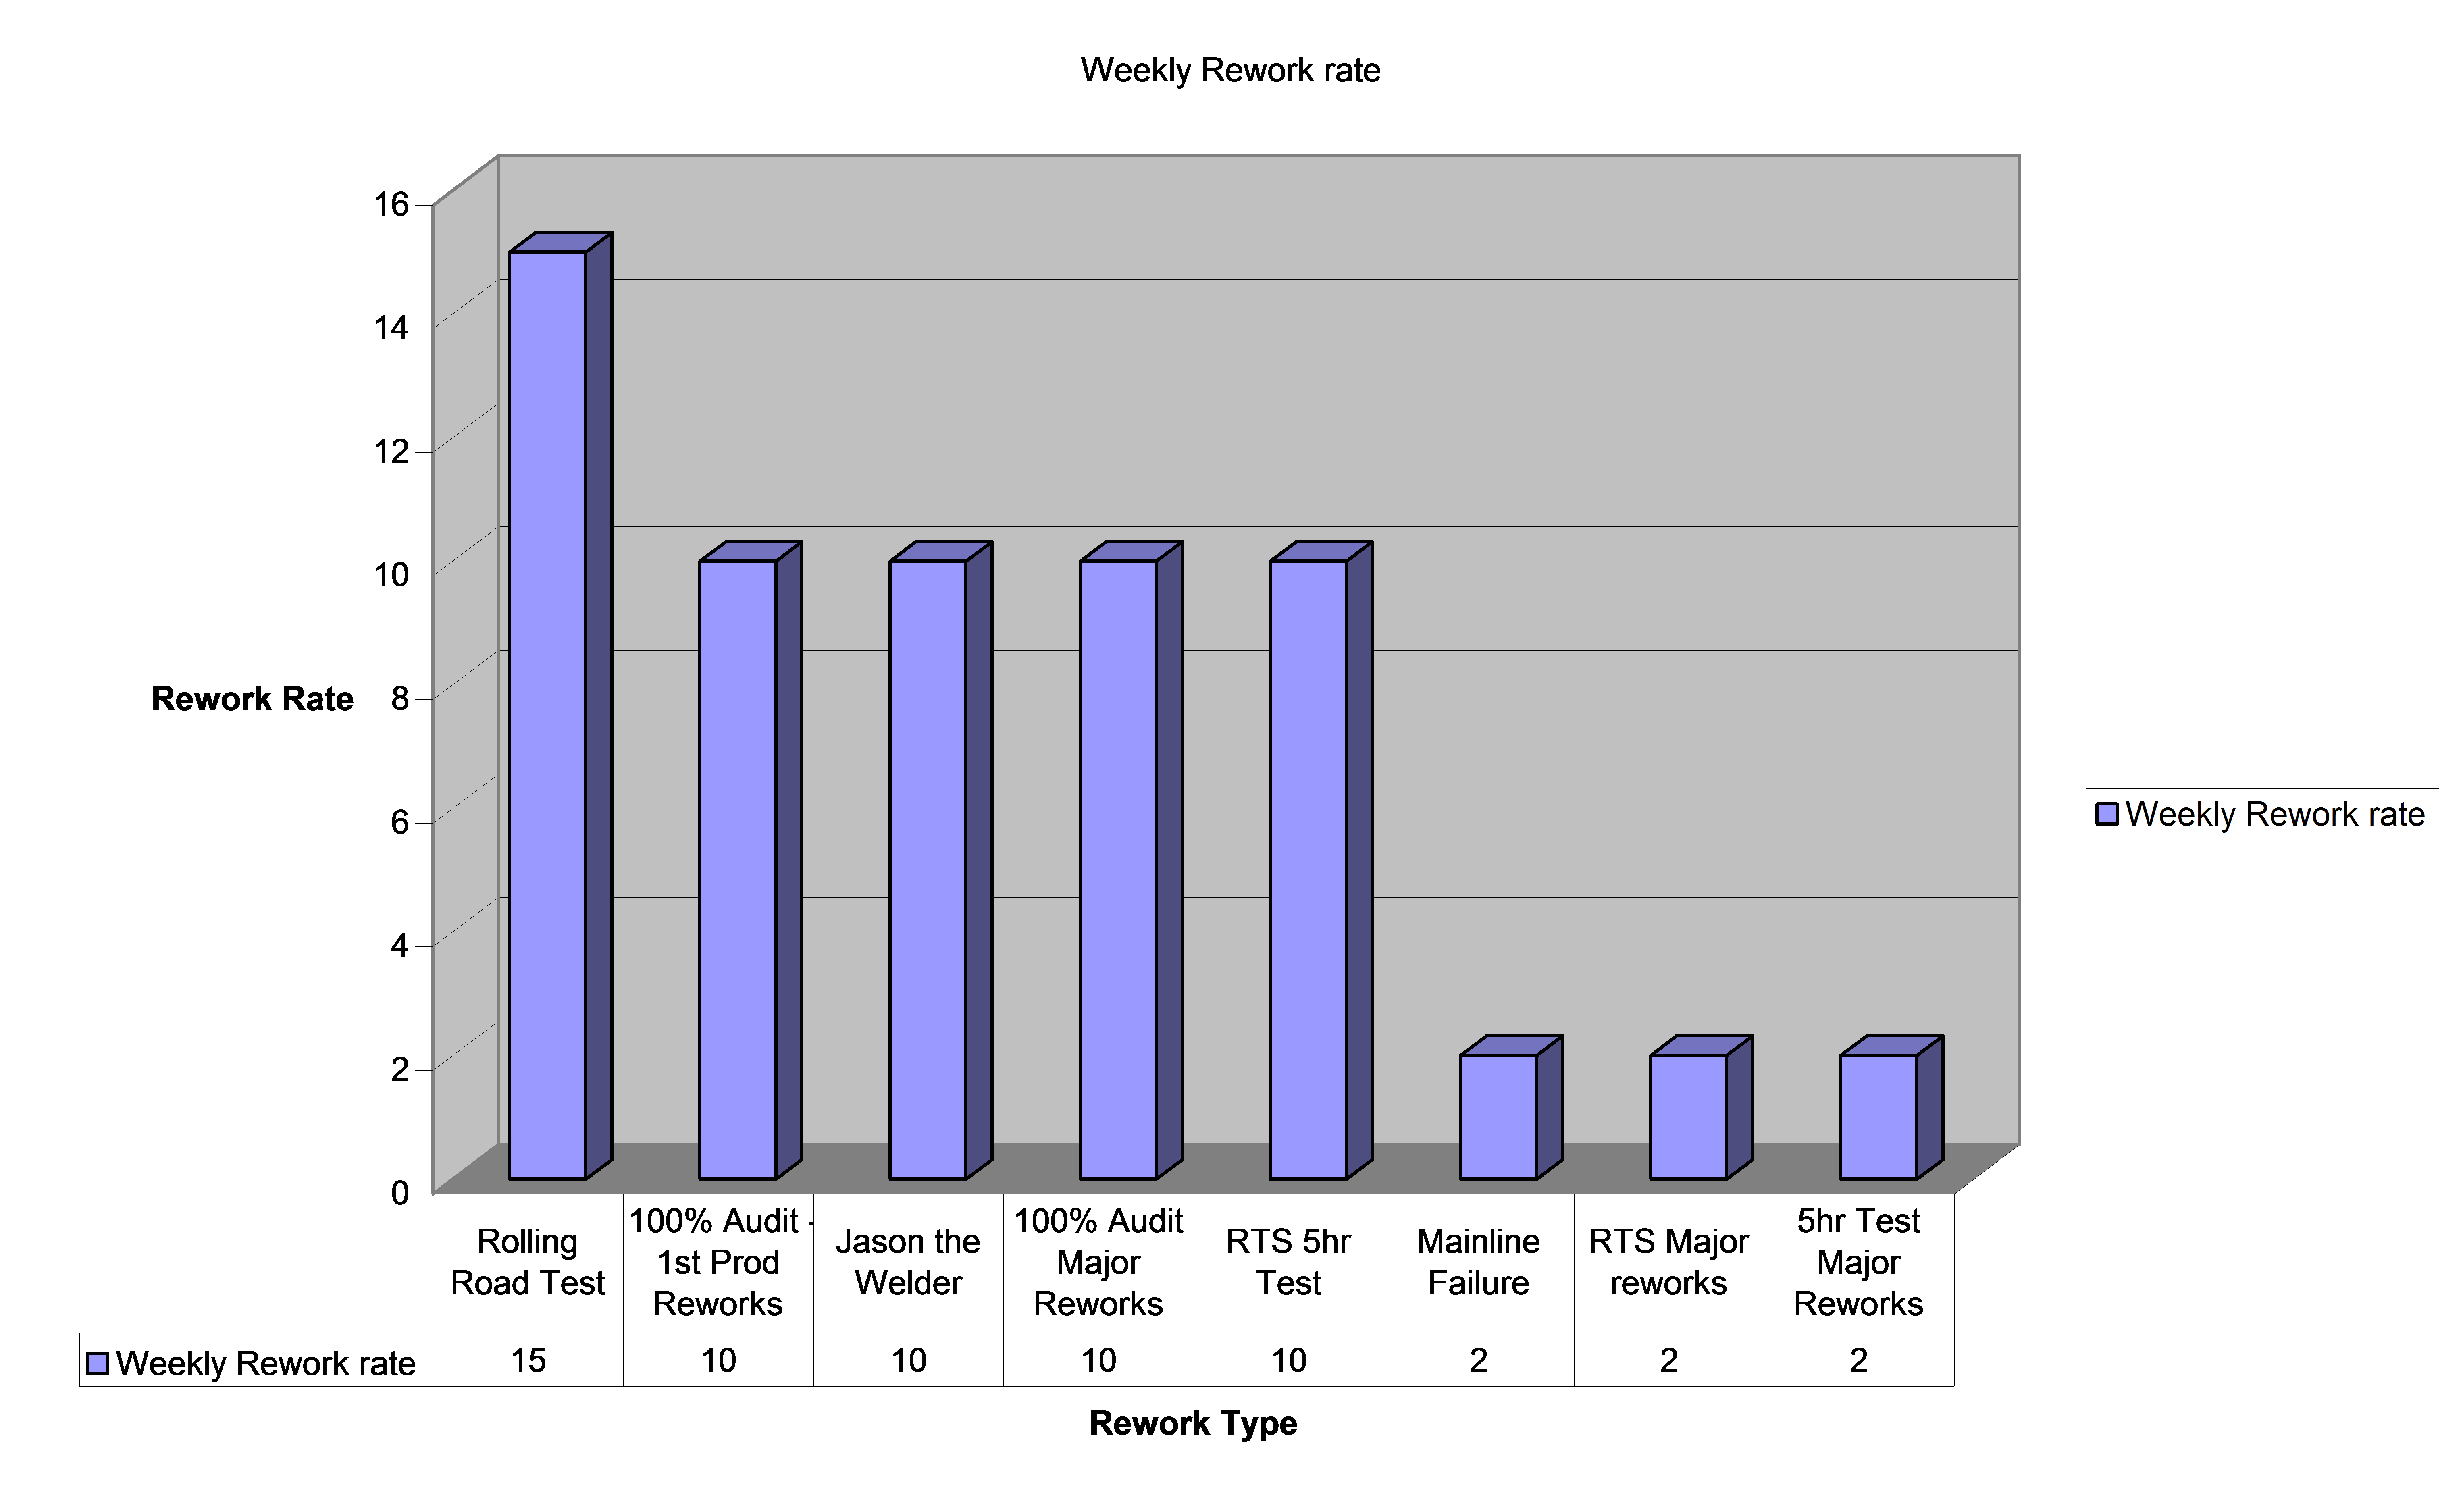 Rate of Rework
Analyze Phase
The engineering change process was then examined in more detail.
There are 2 key decision points: the first, implementation approval, determines whether the business wants to do the change. The second is an engineering approval. This is a technical sign-off indicating that the change is technically correct. This relates to things like ensuring a revised component fits with the components around it, or that stress analysis is acceptable.
Note: BOMs are Bills of Materials; this is the list of components required to make a product, usually structured in a ‘tree like’ hierarchy.
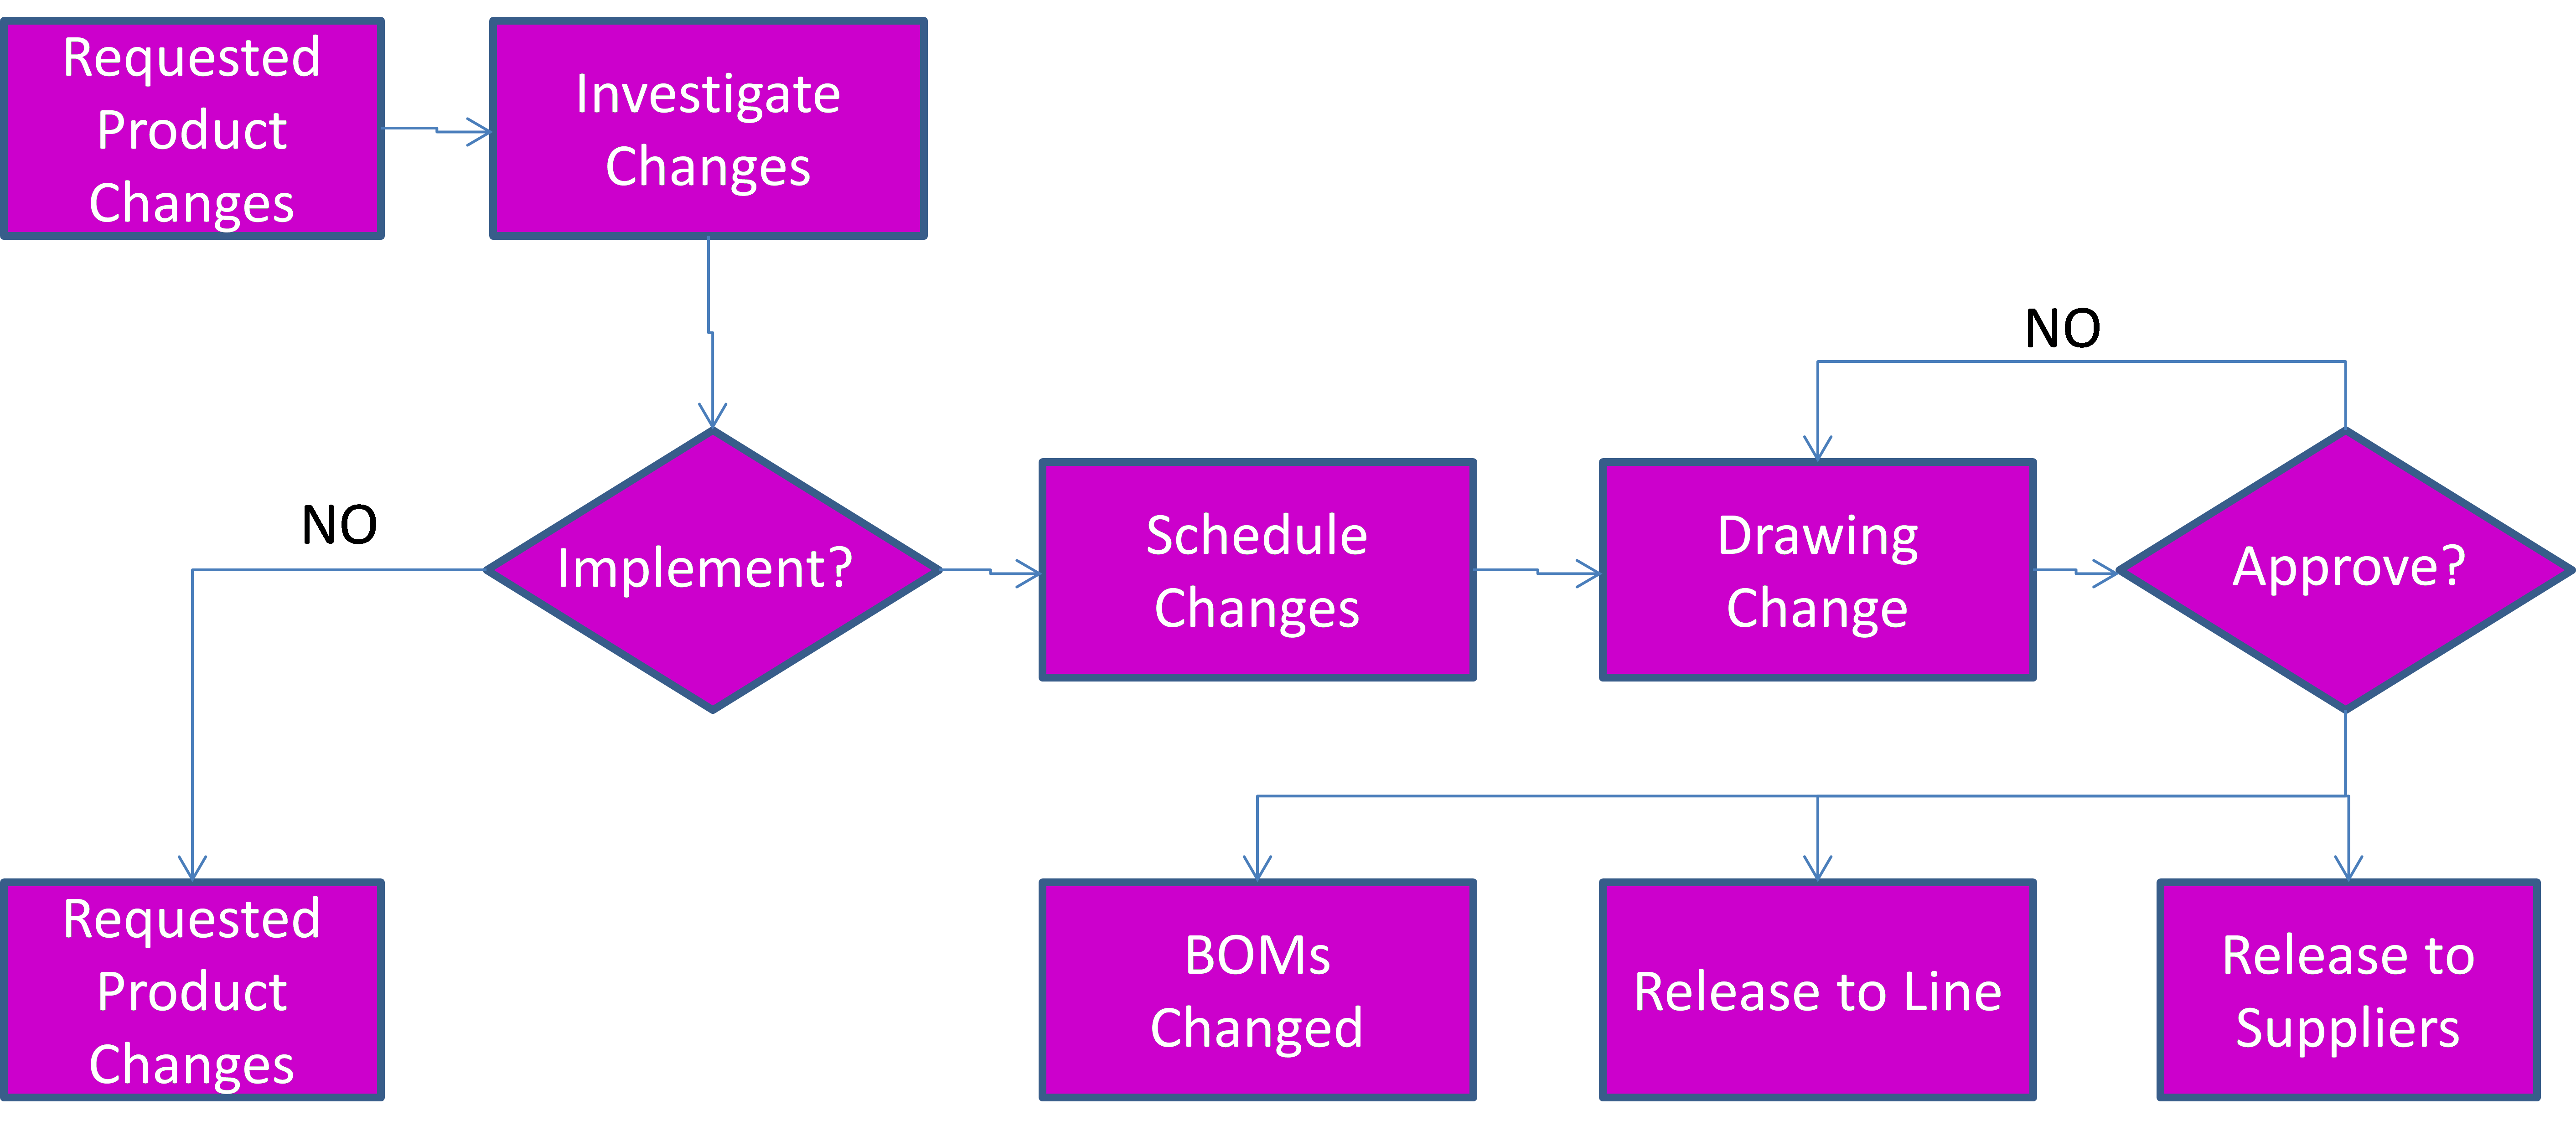
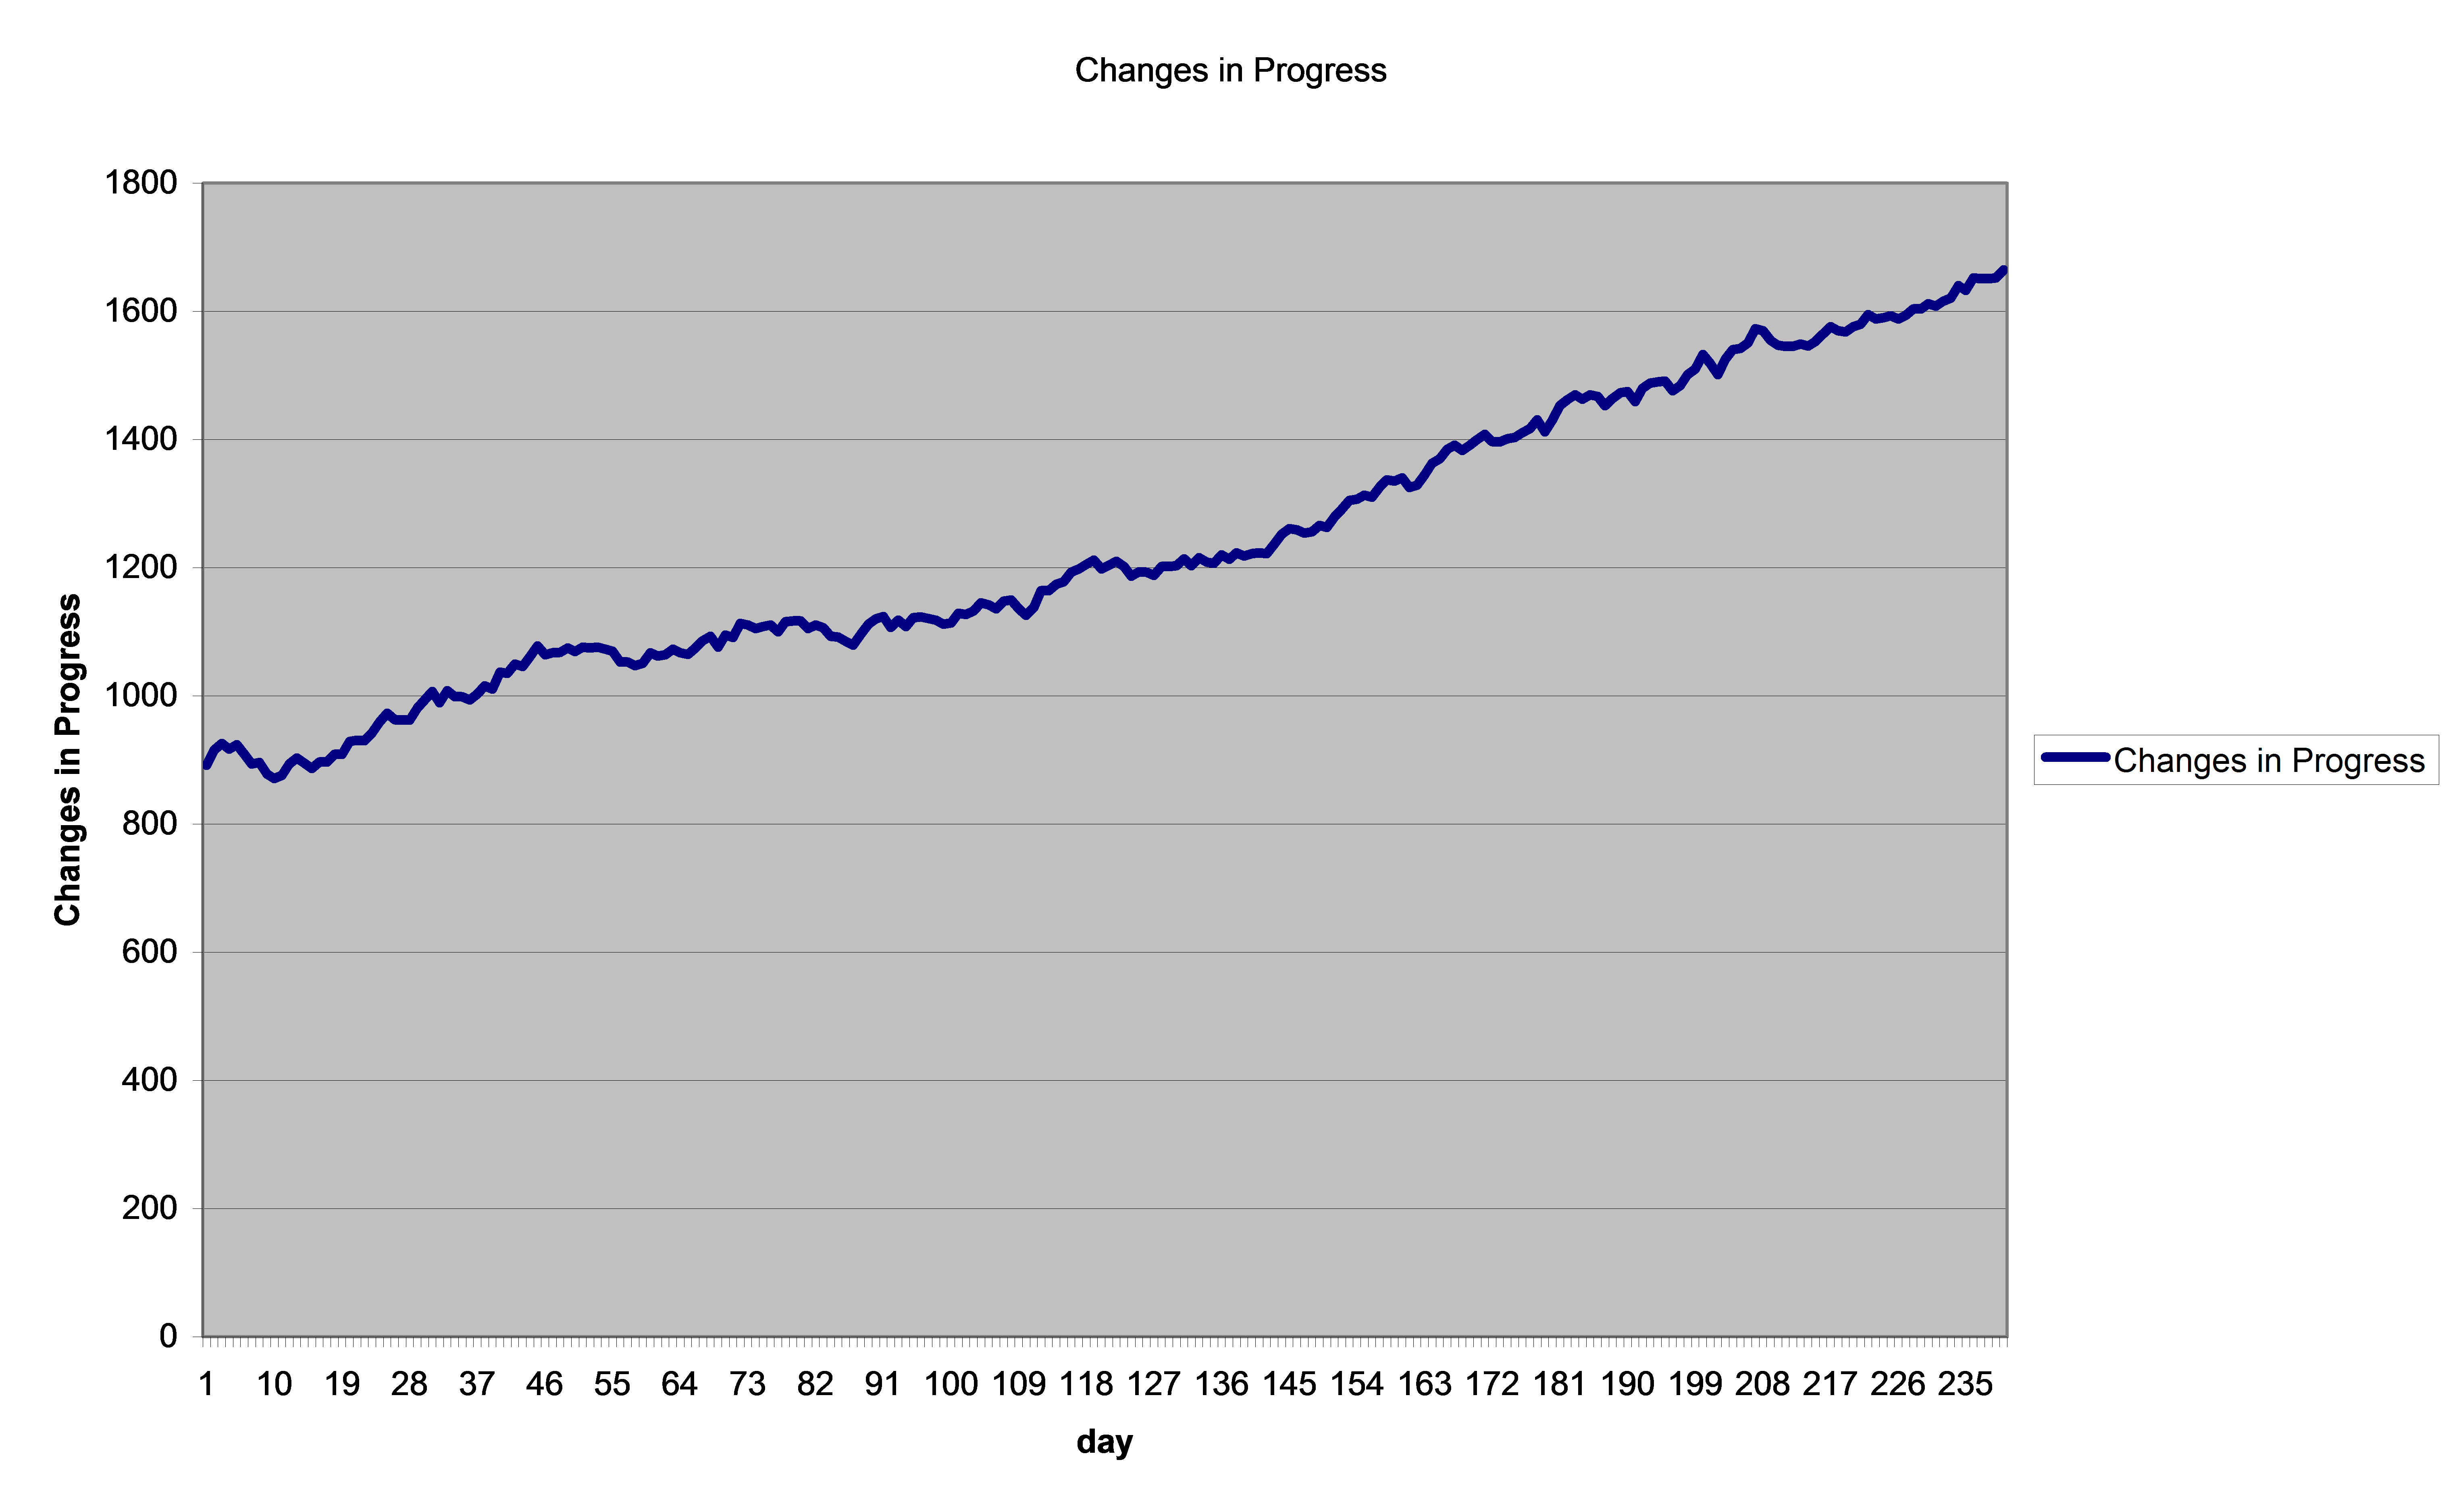
The release of drawings leads to updated bills of material. New drawings then flow through to the users including the assembly line, with work instructions being updated by manufacturing engineering, and also the suppliers. The rate of drawing change was analysed as shown in the Figure below:
 On average, 11 changes were released per day with a standard deviation of 5.93. There was no discernable statistical pattern that emerged and no correlation with weeks.
It is evident was that that there was no effective filtering of the changes being made to the product and that changes are being approved for implementation at greater rate than the ability to execute the engineering drawing release. 3423 engineering changes were approved for implementation and 2635 were actually released, with 231 changes rejected for implementation. The engineering change process is therefore currently overloaded as there is insufficient engineering capacity.
At the beginning of 2007 there were 892 changes in progress, at the end of the year there were 1665. There are 21 engineers currently working in engineering, however their jobs are being evaluated to reduce cost.
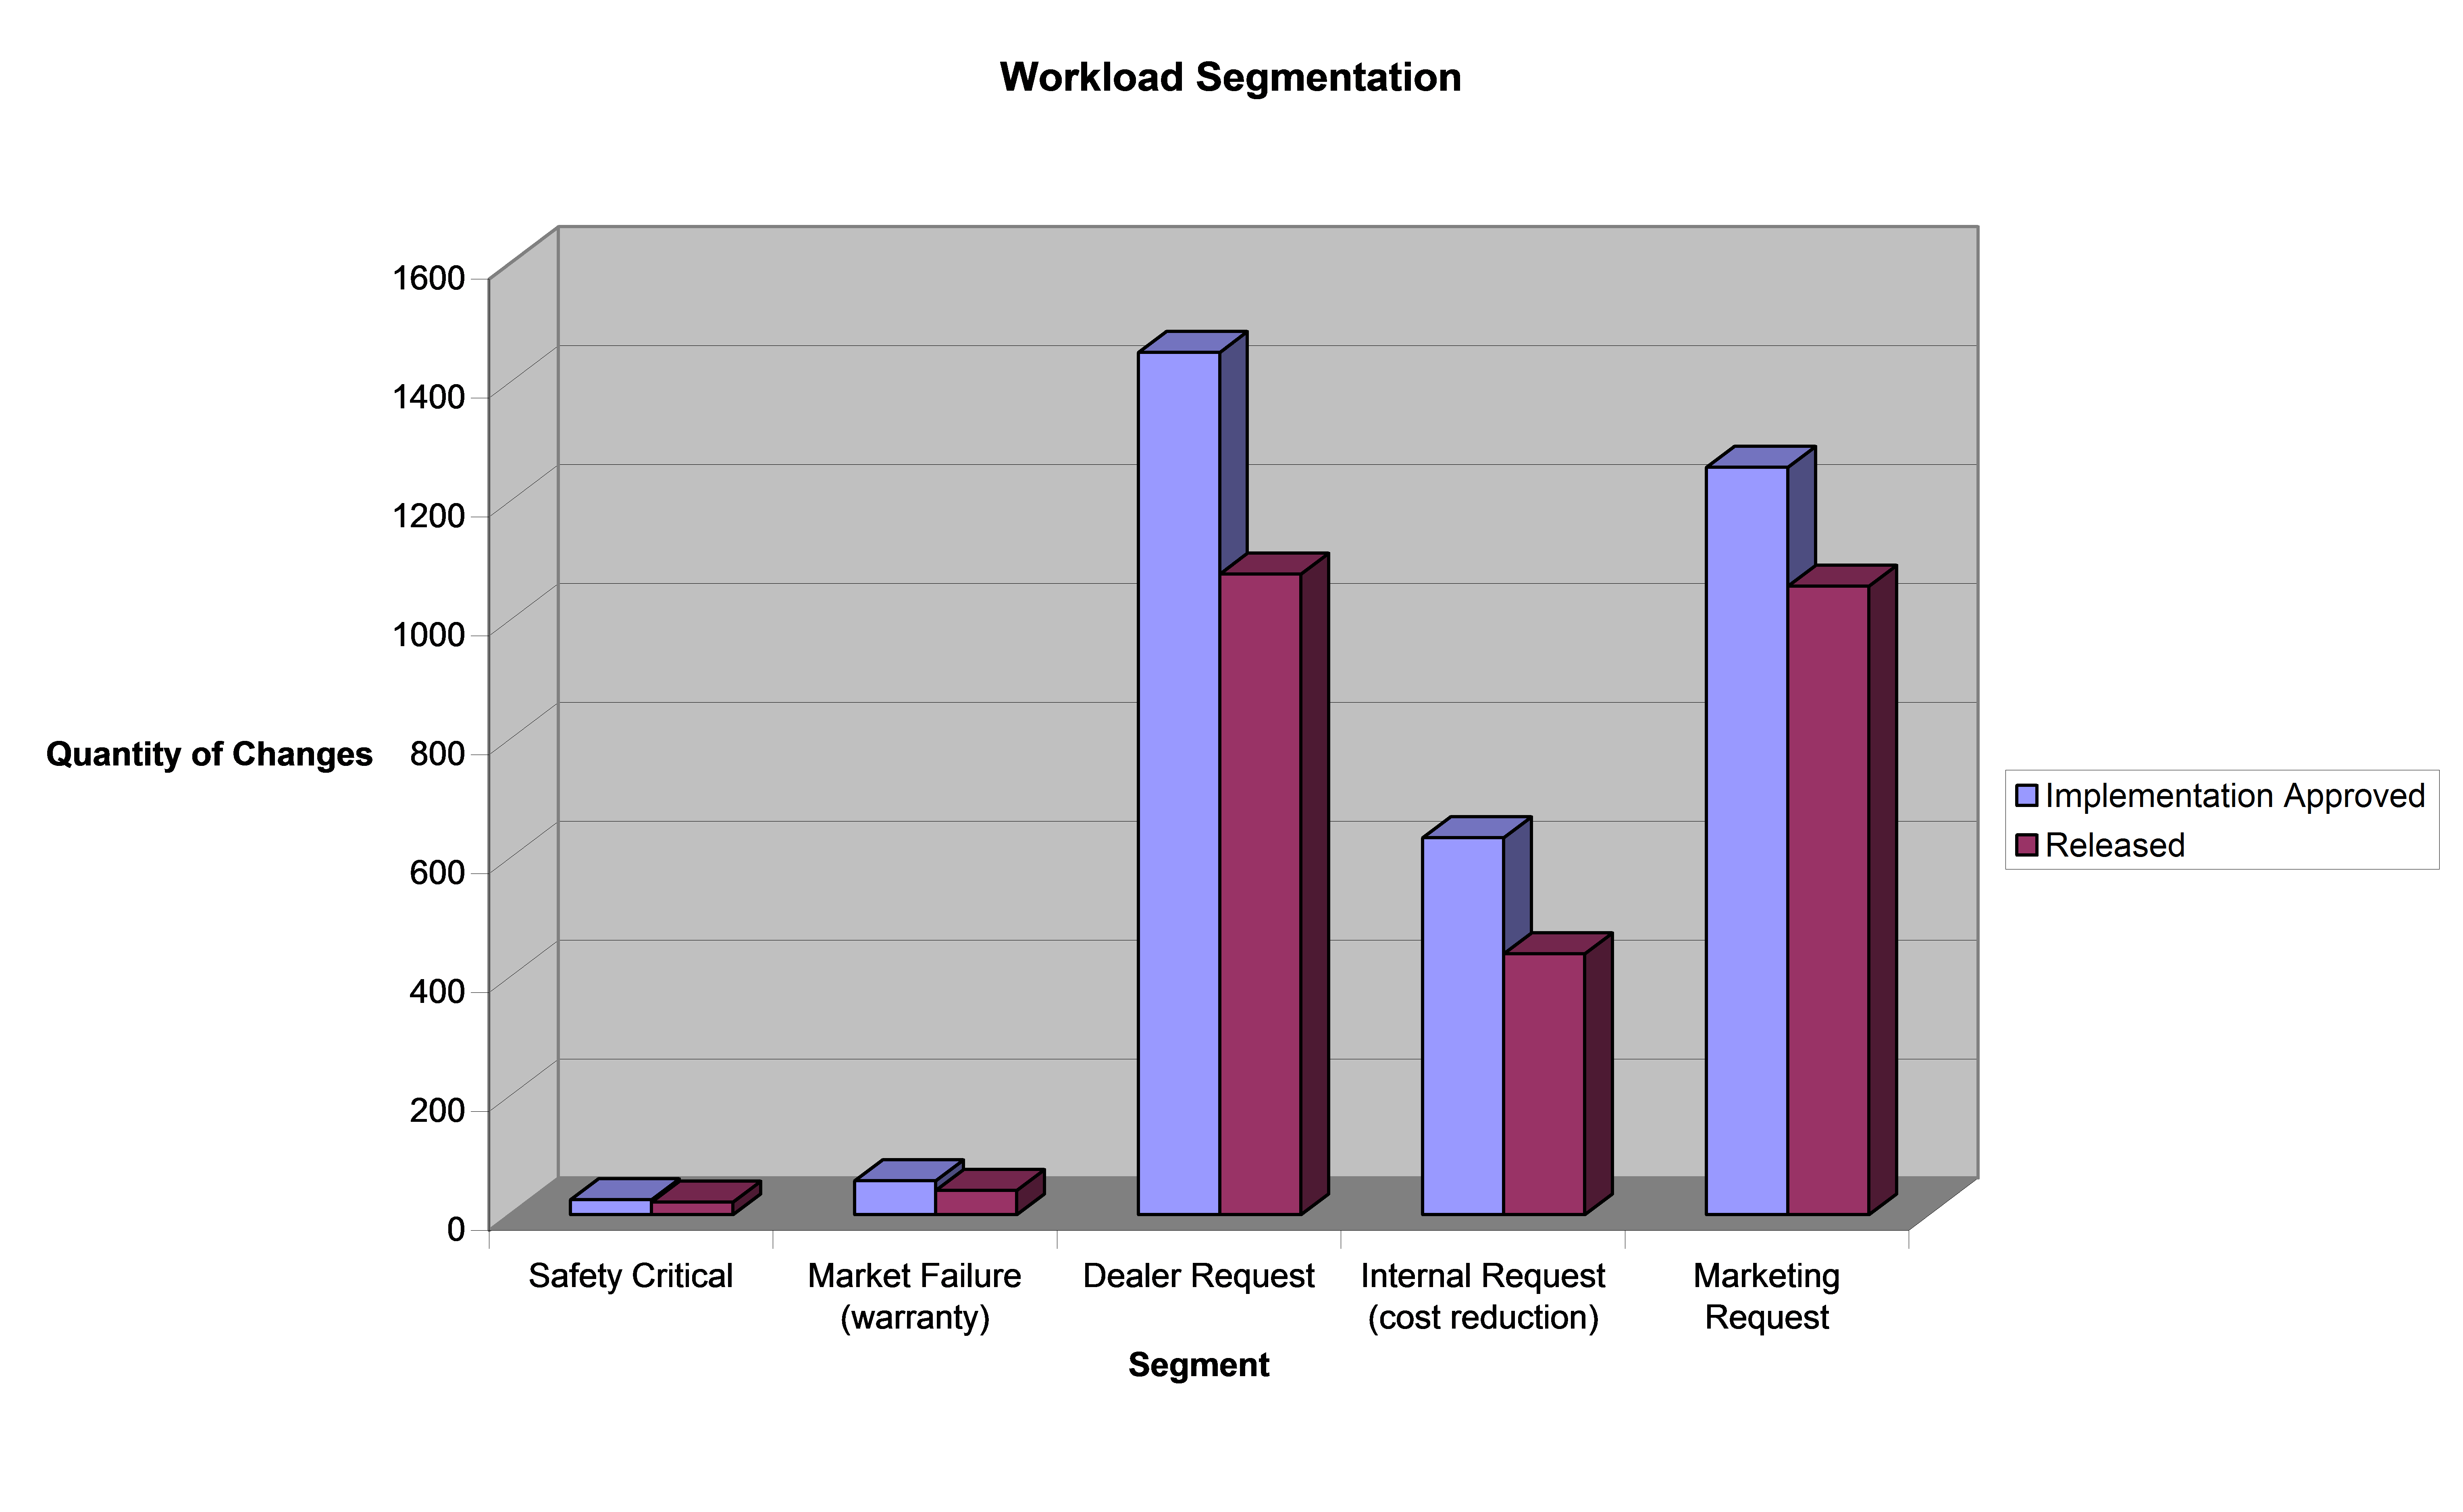
The engineering workload has been segmented using the categories currently used in the engineering change process.
 Safety Critical Changes identified as ‘safety critical’ must be made.
 Action
– Summaries the key issues arising from the first 3 phases of the case
– Prepare a clear Problem Statement which the 6 Sigma team should address.